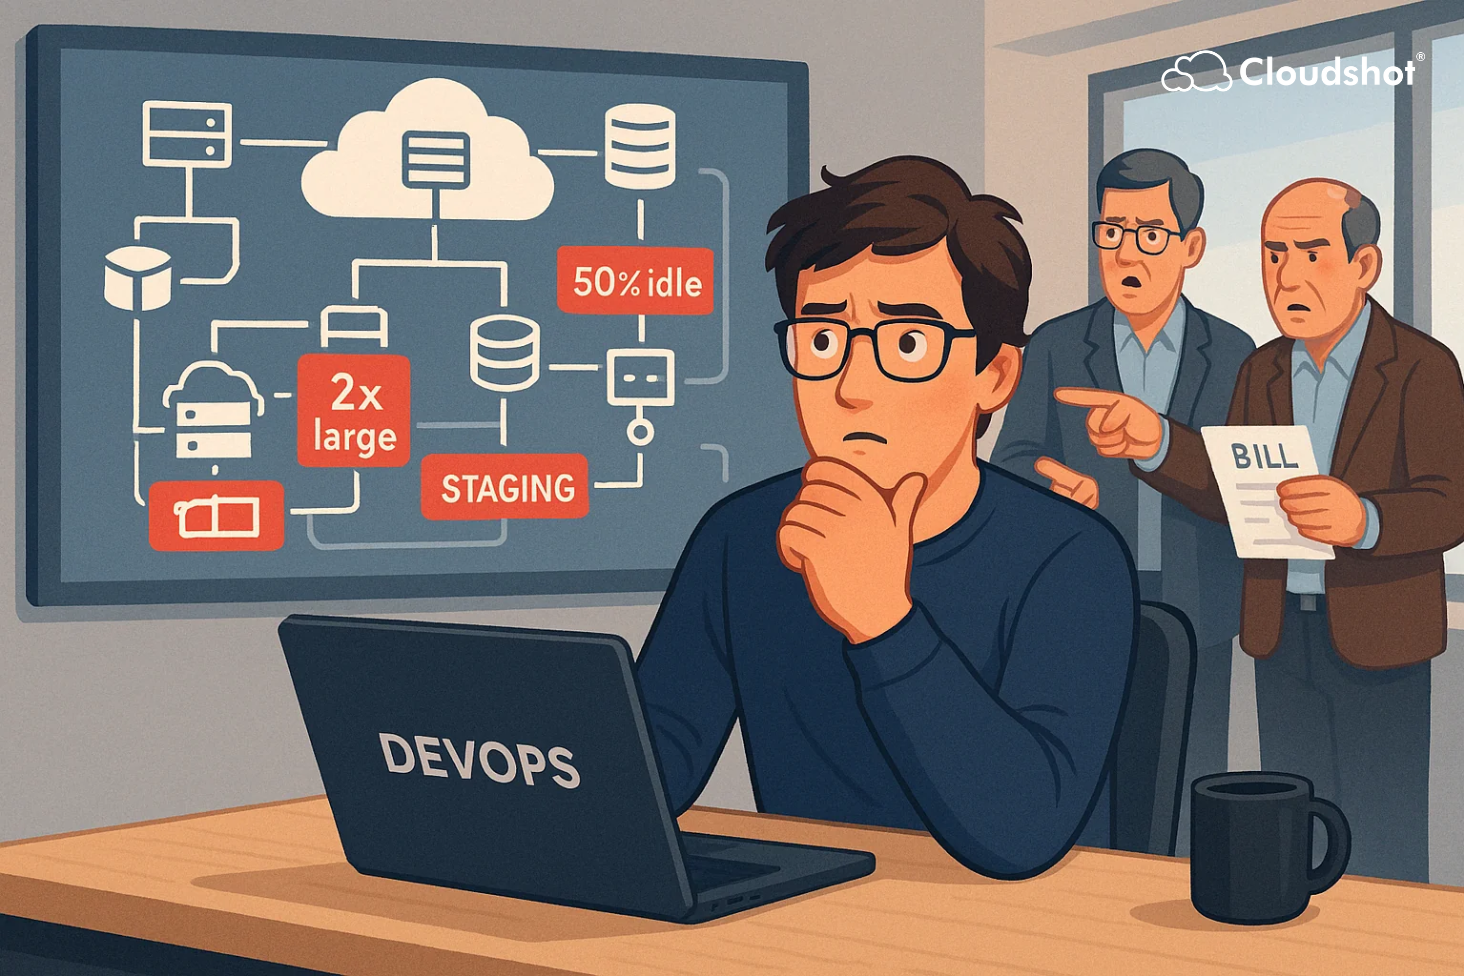
Your CTO is questioning why your staging workloads need 2x large instances. Your CFO is asking why compute spend jumped 18% this quarter.And suddenly, the “safe” infra sizing decisions your team made don’t feel so safe anymore.
This is the daily reality for cloud teams trying to move fast without losing control. And more often than not, the real culprit isn't performance-heavy workloads or huge traffic bursts.
It's over-provisioning.Over-provisioning doesn't look like a mistake. That's why it's dangerous.
A few extra vCPUs "just in case"
Oversized instances "for anticipated growth"
A staging environment provisioned like production—left untouched for weeks
The Silent Drain:
These choices aren't wrong. They're defensive. But multiplied across environments, regions, and accounts—they become a silent tax on your cloud bill. And because nothing breaks, no one notices.
Until the finance team does.
Most cloud teams try to manage this reactively— through cost reports, usage summaries, or Slack reminders to "right-size." But by the time a spike is detected, the money's already gone.
Cloudshot was built to fix this before it starts.
Here's how leading DevOps and cloud teams are using Cloudshot to reduce over-provisioning - Without slowing down delivery
Visualize your live infrastructure vs actual usage
Cloudshot maps every provisioned instance in AWS, Azure, and GCP—then overlays it with real-time usage. You see exactly which resources are too big for what they're doing, right now.
Auto-detect and surface over-provisioned services
Our detection engine continuously scans your infra to identify oversized VMs, containers, and storage—flagging anything with long-term underutilization. You don't have to guess what's wasteful—Cloudshot shows you.
Give teams their own usage footprint
Role-based dashboards mean every team sees their resources, tagged and grouped by service, owner, and environment. They know what they provisioned, what's being used, and what needs attention. That clarity = action without bottlenecks.
Case Study: A DevOps Team at a FinTech Startup Cut $21K/Month in Overspend
One platform engineering team at a growing FinTech company had a gut feeling that they were over-provisioning — but no time to prove it. After connecting Cloudshot, they discovered:
- 3 production clusters with 50%+ unused CPU
- 2 QA environments running on production-tier instances
- Dozens of idle services marked "critical" but untouched in 45+ days
Cloudshot didn't just surface the problem—it visualized it. Their engineers started using Cloudshot's team dashboards to track their own infra sizing decisions. In less than a month, they right-sized environments, deleted dead weight, and reclaimed $21,000/month in cloud waste.
The bottom line?
You don't need to slow down engineering. You just need to stop paying for infrastructure no one's using.
Cloudshot makes that possible—with clarity that's fast, visual, and actionable.
Start your free trial and show your CTO and CFO where the real savings are.
Take control of your cloud footprint today.