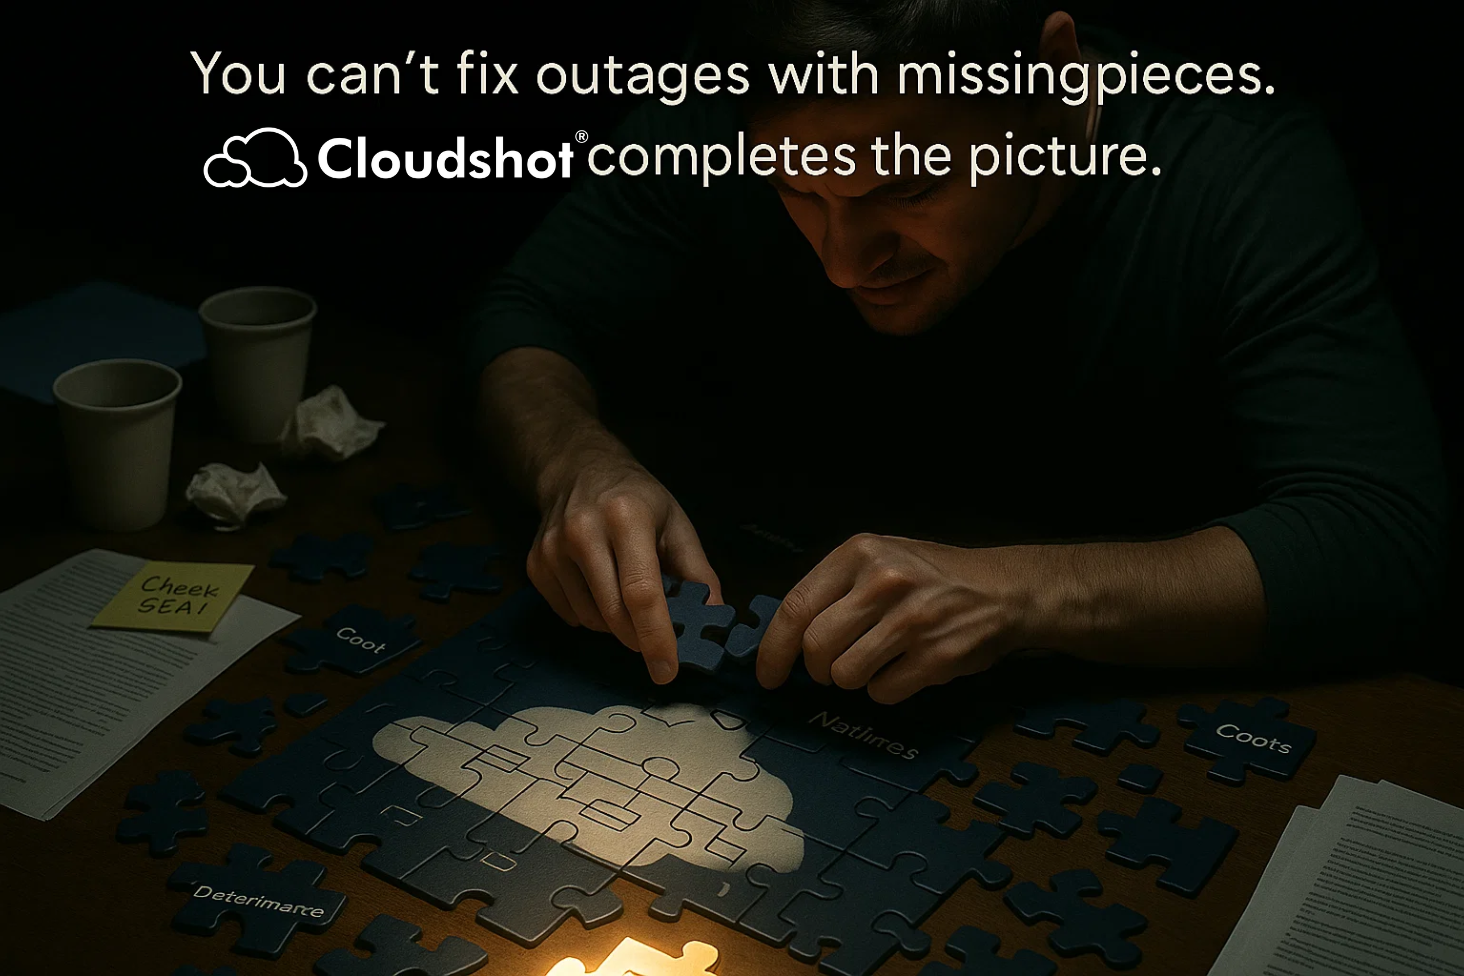
"When something breaks, I open Azure Monitor, then App Insights, then VM metrics. By the time I stitch the story together, hours are gone."
A cloud architect told me recently this exact thing.
If you've ever been in a war room during an outage, you know this isn't an exaggeration. It's the reality for DevOps leads, architects, and engineers every week.
The truth is, troubleshooting across multi-cloud environments is broken — not because teams lack tools, but because the tools don't connect.
The Real Cost of Scattered Logs
Every minute spent bouncing between dashboards is a minute lost to your business. Let's break down the hidden tax:
1. Endless Tab-Switching
When something fails, engineers scramble across consoles — AWS, Azure, GCP, plus monitoring dashboards like App Insights or DataDog. Each shows a fragment of the puzzle. By the time you've pieced it together, your SLA clock is already running out.
2. Wasted Hours, Higher Stakes
Delays don't just frustrate teams. They cost real money. Every hour of downtime means lost transactions, broken customer trust, and frustrated executives asking for answers you don't yet have.
3. Scattered Accountability
Infra teams, app teams, and finance all see different "truths" from their own dashboards. When the root cause isn't obvious, the blame game begins — and that makes incident response even slower.
Why Traditional Monitoring Isn't Enough
Most monitoring tools were designed to detect problems, not explain them. You get alerts, you see spikes, but the context is missing. Logs live in one place, dependencies in another, costs in a third. That fragmentation turns every outage into detective work.
As one DevOps manager put it:
"We weren't short on alerts — we were drowning in them. What we lacked was a way to connect the dots."
How Cloudshot Changes the Game
Cloudshot doesn't replace your monitoring stack — it ties it together with visual intelligence. Instead of fragments, you get a story.
✅ Visual Root Cause Trace
Rather than guessing through logs, Cloudshot maps your stack visually in real time. When a failure happens, you trace the issue from infrastructure to app to service dependency in seconds — not hours.
✅ Centralized Logs and Metrics
No more juggling dashboards. Cloudshot consolidates logs, metrics, and alerts from AWS, Azure, and GCP into one coherent view. Engineers see the full truth on a single screen — without the fatigue of context-switching.
✅ Faster Incident Response
Cutting troubleshooting from hours to minutes isn't just a technical win. It means customers notice fewer outages, finance avoids SLA penalties, and engineers regain confidence that they're in control — not chasing ghosts across consoles.
Proof From the Field
One enterprise team told us:
"We used to waste half a day finding issues. With Cloudshot, we fix them before they become outages."
That's the difference real-time context makes. Cloudshot doesn't just speed up troubleshooting — it restores trust between teams, because everyone sees the same facts at the same time.
Why This Matters for CXOs
For leadership, scattered logs don't just mean delayed fixes — they represent systemic risk:
Missed SLAs
Direct financial penalties and broken customer trust.
Slower teams
Engineers spending more time firefighting than building.
Weaker governance
Siloed data making it harder to align infra, security, and finance.
Cloudshot resolves all three by turning chaos into clarity.
From Firefighting to Confidence
Troubleshooting doesn't have to be guesswork. With Cloudshot, your team walks into every incident armed with clarity, context, and control.
See Cloudshot in Action
Start your free trial today and see how Cloudshot flips the script on root cause analysis.
