Cloud cost spikes rarely arrive with warnings.
They don't trigger alerts. They don't break systems. They often appear mid-cycle, quietly reshaping forecasts while infrastructure continues to operate normally.
Finance notices the increase first. Engineering checks dashboards and sees nothing failing. Both teams are correct—and still disconnected.
This gap exists because cost is an outcome, not a signal. And without visibility into system behavior, teams are left explaining spend after the damage is already done.
When Cost Increases Without Failure
Modern cloud systems are designed to adapt.
Autoscaling absorbs load.
Retries protect reliability.
Traffic reroutes around partial degradation.
These mechanisms work exactly as intended. But every adaptation changes usage patterns.
A small routing change can increase cross-region traffic.
A slightly slower dependency can amplify retries downstream.
Scaling rules respond automatically to preserve performance.
Nothing breaks. But usage increases—and so does cost.
From Finance's perspective, the spike feels sudden.
From Engineering's perspective, the system looks healthy.
What's missing is visibility into behavior → spend causality.
Why Traditional Explanations Arrive Too Late
Most FinOps tooling focuses on billing data. It explains where money went, but not why.
Engineering tools focus on health and performance. They show whether systems are working, not what they cost.
When a spike appears, teams reconstruct the story manually:
comparing deployment timelines
reviewing infrastructure metrics
correlating cost exports with system changes
This process is slow and often incomplete. By the time an explanation emerges, the opportunity to prevent further impact has already passed.
Cost management becomes reactive instead of operational.
Cost is a Downstream Effect
Cloud spend does not change randomly.
It follows behavior.
Usage increases because systems adapt.
Costs rise because architectures respond to change.
Treating cost as a financial anomaly obscures the real signal. Cost is a symptom of how infrastructure behaves over time.
To explain spend, teams need to see:
what changed
how behavior shifted
where usage amplified
which services absorbed pressure
Without this context, FinOps conversations stall.
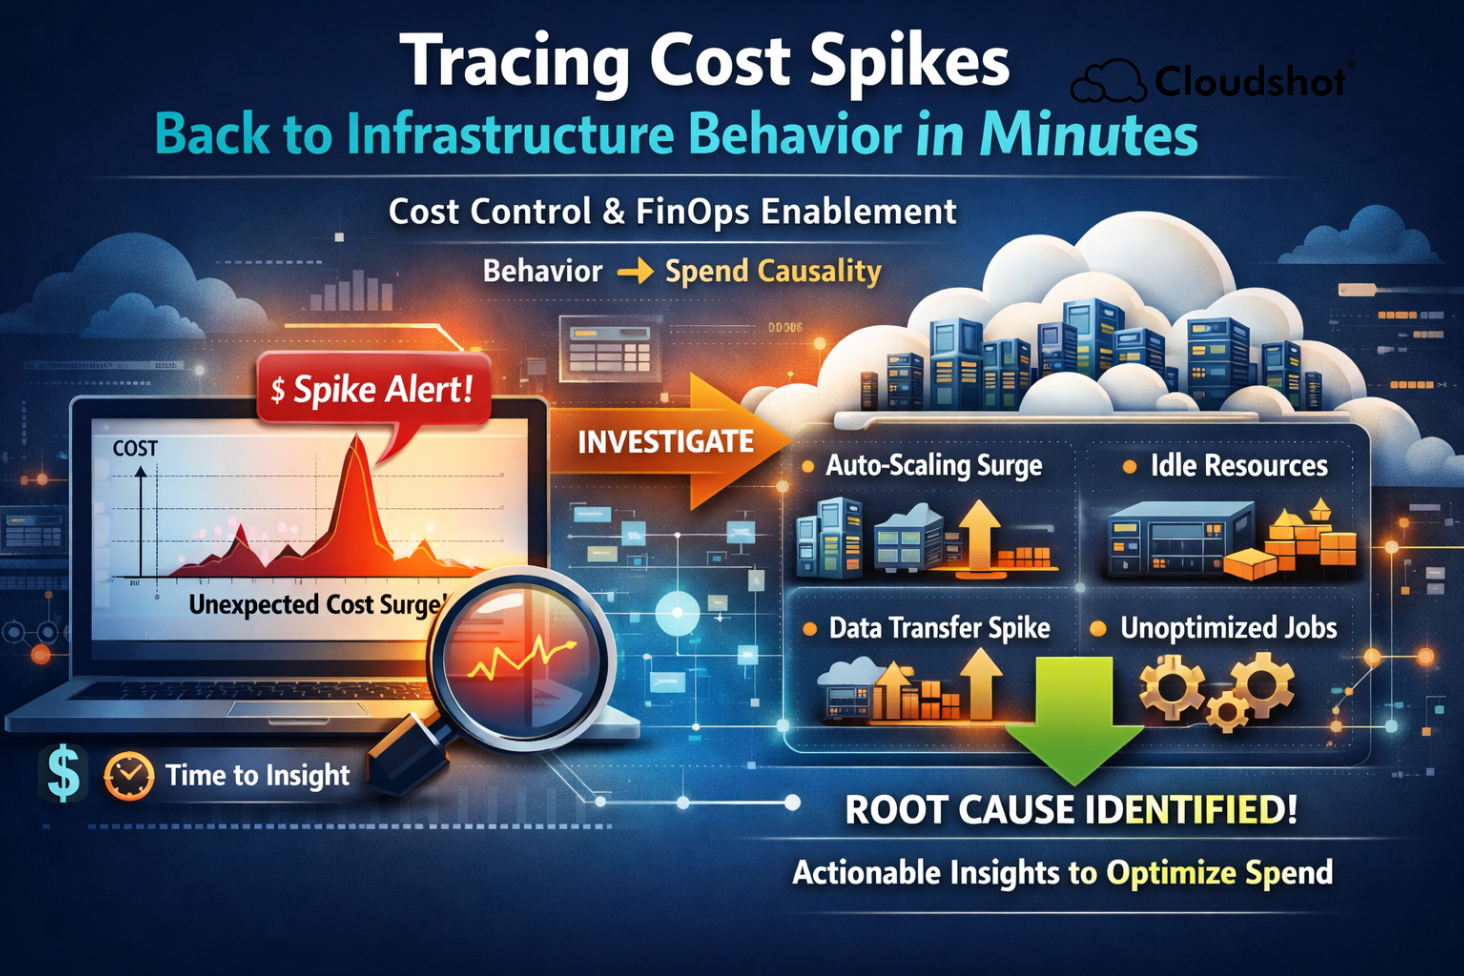
Tracing Spend Back to Behavior with Cloudshot
Cloudshot connects cost signals directly to live infrastructure behavior and change history.
Instead of starting with an invoice and working backward, teams can trace spend forward:
from configuration or routing changes
to traffic redistribution
to scaling responses
to cost impact
All within a shared, visual timeline.
Architects and FinOps teams see the same story at the same time. Cost explanations arrive in minutes, not weeks.
A Familiar Scenario, Explained Early
A mid-cycle cost spike appears.
Traditionally, this would trigger escalation. Finance demands answers. Engineering searches for causes.
With behavioral context, the explanation is immediate.
A routing update increased cross-region traffic.
Retries amplified downstream usage.
Autoscaling expanded capacity exactly as designed.
The spike wasn't waste. It was behavior.
Because the cause is visible early, teams can intervene before costs compound further.
From Reporting to Prevention
The most effective FinOps teams don't just explain spend. They anticipate it.
When cost is treated as a behavioral signal—not a surprise—teams align faster, act sooner, and regain control.
This is how FinOps moves from reporting to prevention.