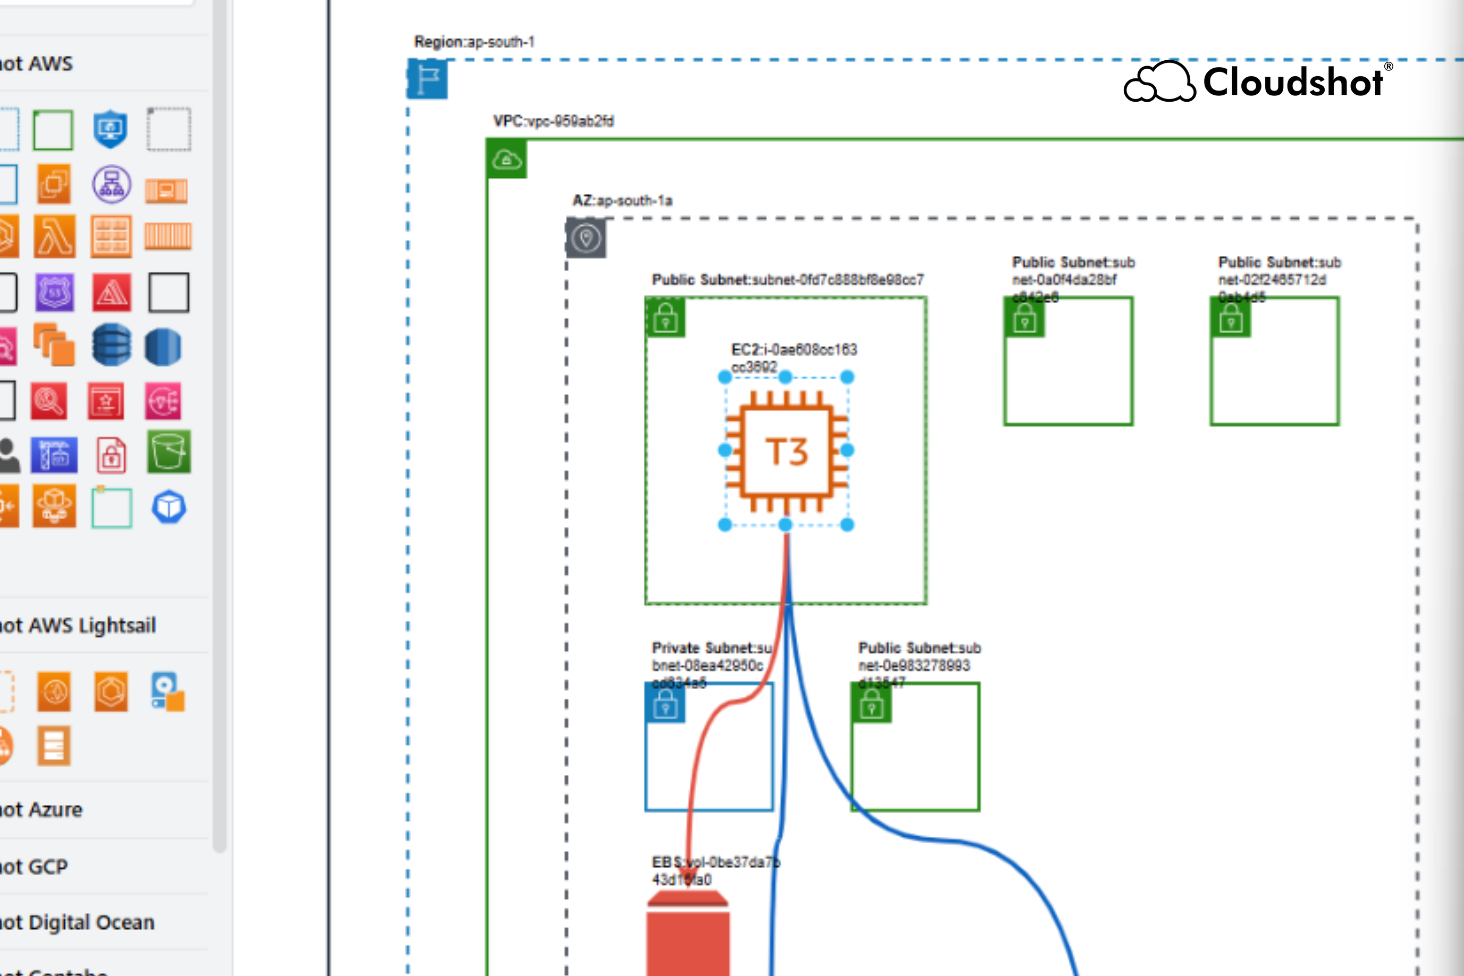
"What's this… why are we paying for 11 security groups that aren't linked to anything?"
That's what a cloud lead asked after seeing their infrastructure mapped inside Cloudshot for the very first time. No exaggeration — in under 5 minutes, they found:
- A pile of unused security groups
- Detached EBS volumes still billing silently
- Subnets left untouched for months
- Several underutilized components that had long outlived their purpose
They'd been reviewing billing dashboards for months — but none of it had surfaced this. And the reason is painfully simple: they couldn't see it.
Modern Cloud Teams Are Flying Blind
Most teams today juggle infrastructure across AWS, Azure, and GCP. But when it comes to understanding what's really running — and what shouldn't be — the picture gets murky fast.
Because resource sprawl is invisible until it isn't.
Orphaned VMs, forgotten staging environments, and zombie storage volumes don't trigger alarms. They just sit there — silent, untracked, and billing every hour. And legacy tools only add to the confusion with fragmented lists, delayed reports, or siloed cost summaries.
The Silent Drain:
The result? A slow bleed. Budgets spiral. Forecasts miss. Accountability fades. And most teams only react after the damage is done.
This Is Exactly Why Cloudshot Built the Real-Time Visual Cloud Map
Instead of drowning in fragmented lists and cryptic tables, Cloudshot transforms your infrastructure into an interactive visual blueprint that brings clarity to complexity.
See everything across all your cloud accounts, providers, and regions—unified in a single, coherent view.
This isn't a static diagram or a weekly PDF export. It's your live, running cloud, mapped in real time—complete with visual links, policy associations, and environment-level grouping.
Every EC2
Every Subnet
Every Load Balancer
If it's provisioned, Cloudshot shows it—right where it belongs, and how it connects with everything else.
And that visibility unlocks far more than clarity—it enables:
Here's What One Customer Achieved in Under a Week:
Identified and removed 20+ idle resources across 3 AWS regions
Caught 11 unlinked security groups that had been overlooked for months
Cleaned up orphaned storage and networking assets
Reclaimed $14,000/month in waste — without altering production workloads
Created team-level dashboards to assign ownership by service, region, and environment
"We thought we had good visibility. But Cloudshot showed us what we were actually running."
So What Makes This Feature Different?
Let's get specific:
Auto-detection across providers
Cloudshot maps your AWS, Azure, and GCP infra in one place — no integrations, no manual mapping
Live sync with current state
If your infra changes, your map updates in real time — not in hours or days
Clickable, drillable components
Every icon isn't just a shape — it's connected to metadata, tags, usage, and alerts
Cross-team alignment
Executives see costs. Engineers see architecture. Everyone sees the same truth.
In short: it's a real-time map of your cloud reality. Not what you think is running. What's actually there.
You Can't Optimize What You Can't See
The cost of cloud waste isn't just financial — it's strategic. When visibility is missing, teams slow down, trust evaporates, and budgets explode without answers.
Cloudshot fixes that at the source — giving your entire team, from DevOps to CFO, a shared lens into your live infrastructure.
And when you can see what's idle, orphaned, or outdated in real time… you don’t just cut waste, you prevent it from happening again.
See Your Infrastructure Like Never Before
Stop flying blind with your cloud resources. Gain real-time visibility, cut waste, and take control of your infrastructure with Cloudshot's Visual Cloud Map.
